How PRI works
One question, four sliders, one clear signal
A daily check-in that takes seconds, aggregated into a live view of organisational stability and the direction it is moving.
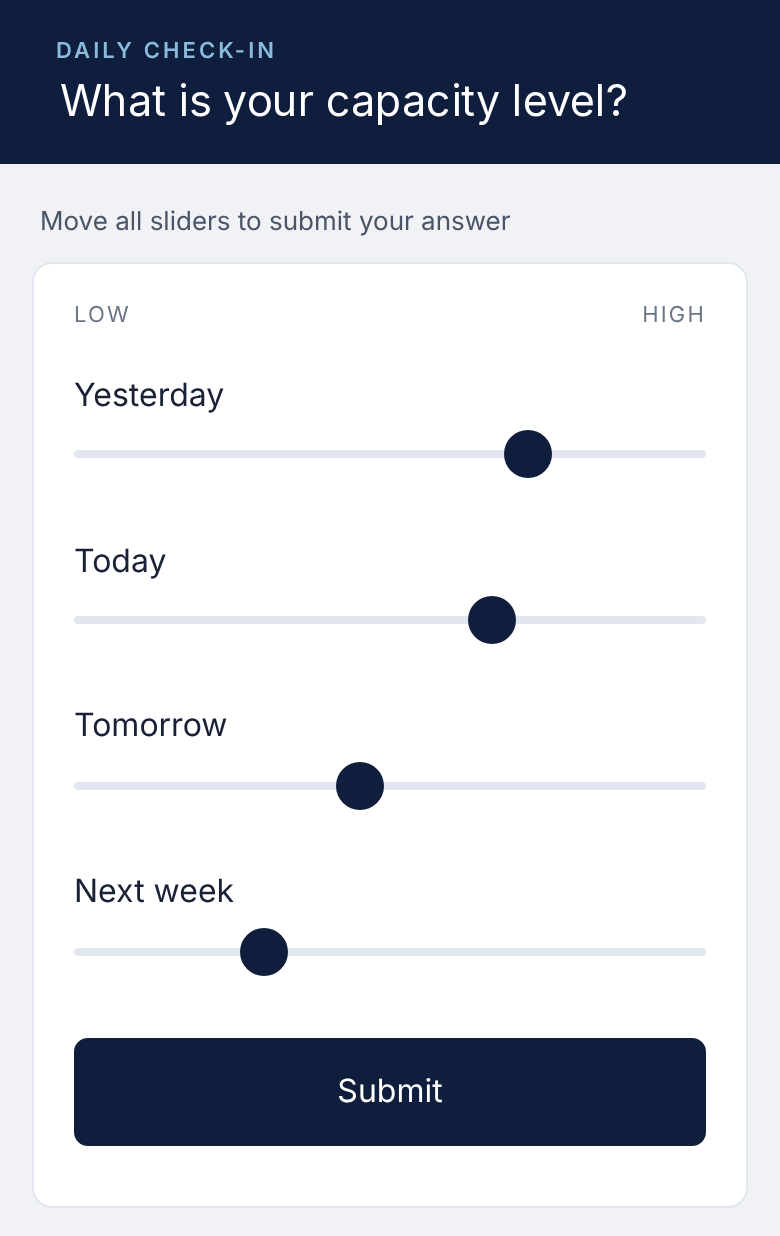
The check-in
Ten seconds a day, nothing to install
People complete a ten-second daily check-in covering yesterday, today, tomorrow and next week by moving four sliders. There are no numbers to agonise over and no free text. It is voluntary and anonymous, opened from a link by email, Teams or the intranet.
Workforce Capacity
Yesterday and today: capacity available now.
Forward Stability
Tomorrow and next week: outlook for organisational stability ahead.
Trend
Momentum against a 4-week average: improving or deteriorating.
Signal Coverage
How many invited people responded: how much weight the reading carries.
What leadership sees
Shifts show up in days, not survey cycles
One view, updated daily: where the organisation sits, which way it is moving, and how many people are contributing.
The Stability Map
The quadrant to watch is Eroding: people are still delivering but expect things to get harder. Conventional metrics would show nothing yet.
Four positions
Workforce Capacity on one axis, Forward Stability on the other, each split at the midpoint.
After a management action, the map shows whether the organisation moves back towards Strong within weeks, not at the next survey.
The trend and the signal behind it
Read it like a share price: the daily line, the 4-week average, and response volume underneath.
Illustrative, simulated data: a restructuring is announced in week 5 and management acts in week 8.
Why not a pulse survey?
A pulse survey asks for opinions every few weeks. PRI takes seconds a day, asks about outlook for next week as well as how people are now, and turns the answers into one stability signal with a measure of how many people stand behind it.
What PRI is not
Designed to complement what you already have
Not a diagnosis
PRI indicates that organisational stability may be changing and where to look. Your existing management information and surveys help explain why.
Not a wellbeing programme
It is a performance and governance indicator for leadership: can the organisation sustain delivery through change?
Not individual monitoring
Nobody’s answers are ever visible. Leadership sees group results only.
See what PRI could show in your organisation
We are happy to walk you through a live demonstration.